Incremental Capacity Analysis dQ/dV
TLDR: dQ/dV doesn't interrogate your cell or demand a confession. It just looks closer at the answers your cell already gave you during a normal cycling test.
Differentiate the V vs. Q data you already collected, and the chemistry hiding inside a flat plateau jumps out as a sharp, traceable peak. No teardown, no new equipment, no drama. So fetch.
Incremental capacity analysis (ICA), better known by its equation name dQ/dV, is one of those techniques that feels like it should require something fancier than what it actually does.
It gives you a fingerprint of the different electrochemical reactions happening in the cell, and a way to watch those reactions evolve, degrade, or vanish over hundreds of cycles.
Advantages:
Accessible: derived from galvanostatic cycling data, no fancy equipment
Noninvasive: no need to break apart your cell
Flexible: applicable to both half and full cell configurations
What is dQ/dV Analysis?
During galvanostatic cycling, current is held constant and the voltage response is measured. Plotting capacity against voltage produces a profile that's either S-shaped or with flat plateaus, depending on the cell chemistry. The problem: small but meaningful changes in that curve are genuinely hard to see by eye. A plateau that's losing a little capacity each cycle just looks like... a slightly shorter plateau.
We can take the capacity (Q) and differentiate it with respect to voltage (V), then plot dQ/dV against V. Small plateaus become distinct peaks that are easier to visualize. Subtle shifts that were invisible in the raw curve are suddenly obvious and easy to track across cycles (Figure 1).
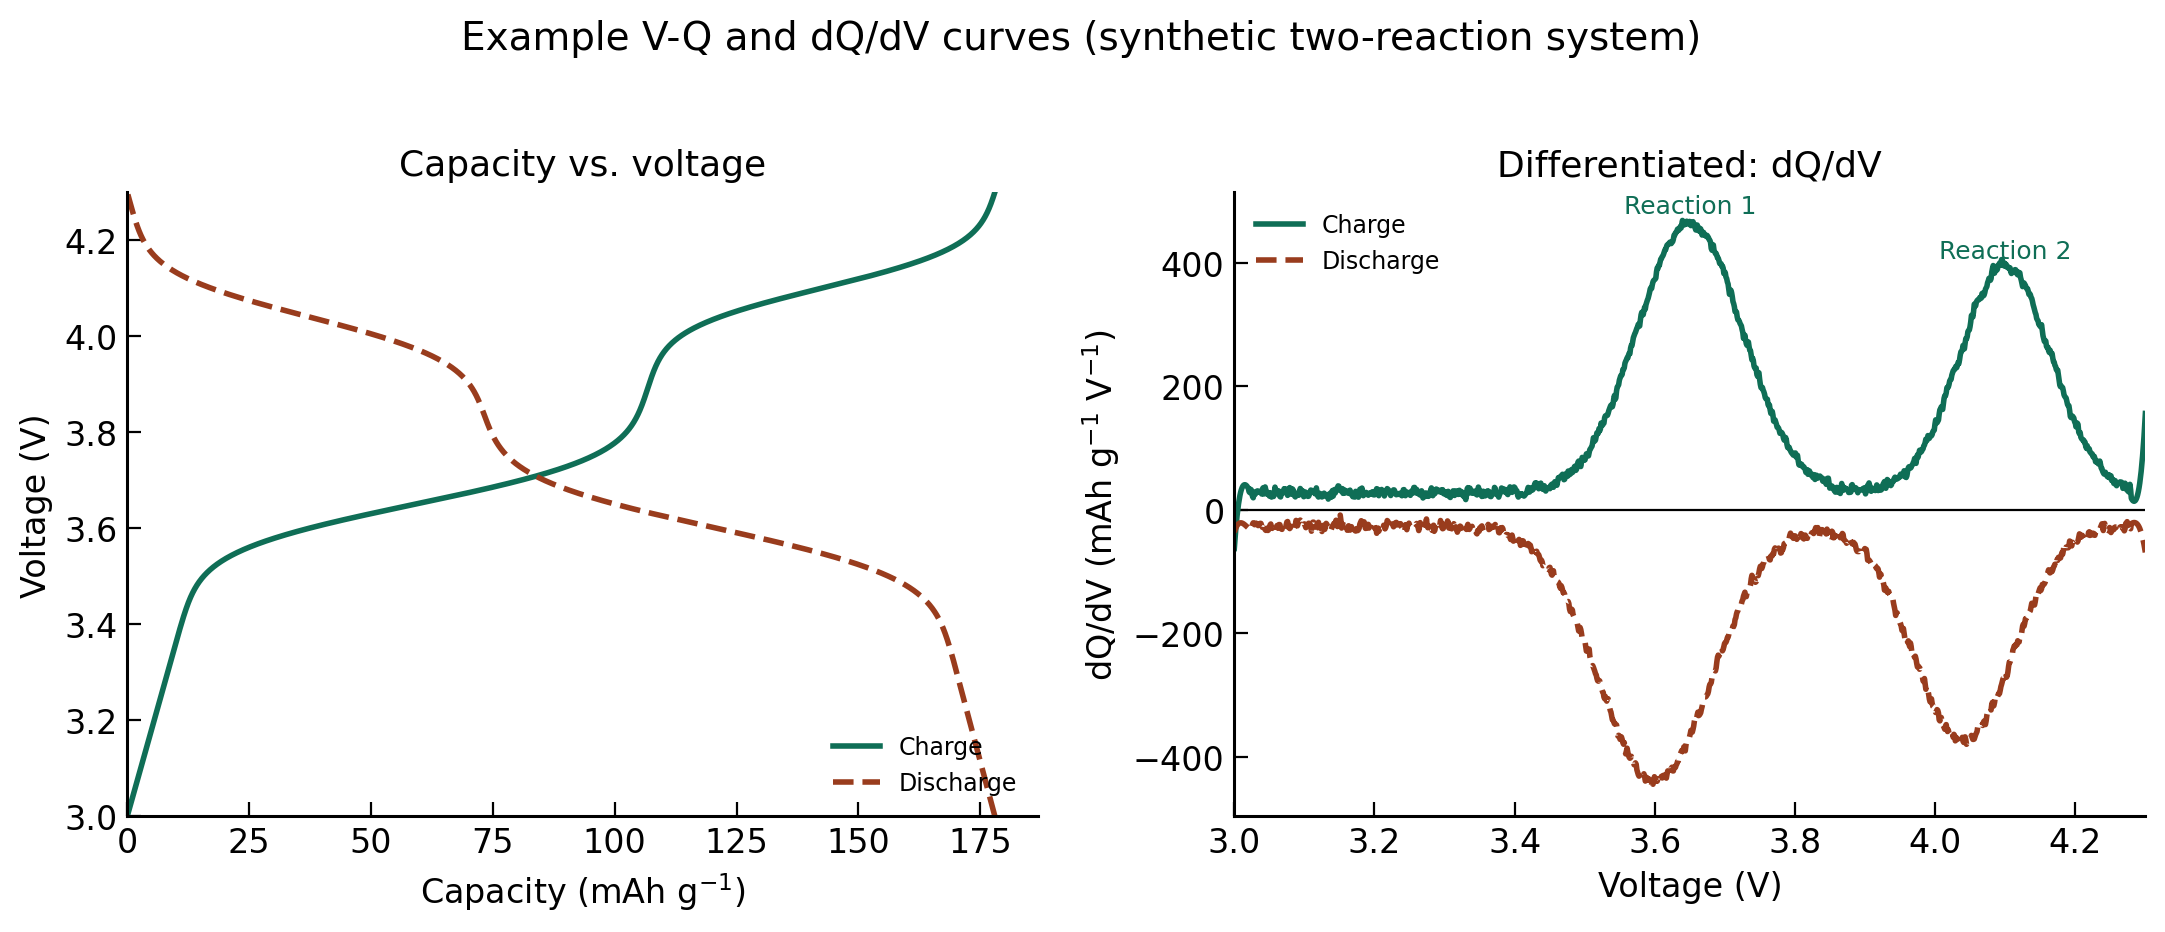
Figure 1. An example Q vs. V plot and the resulting dQ/dV curve after differentiating.
Experimental Considerations
A few things matter before you trust your peaks:
Current density: C/10 or slower is typical. Push the rate too high and kinetic limitations start contributing to peak shape
Environmental consistency: Temperature swings between runs introduce variability that has nothing to do with your material. Reproducibility depends on keeping conditions stable.
Sampling frequency: You need enough data points to actually resolve small features. Sparse sampling can smear or hide real peaks before you ever get to the differentiation step.
Data smoothing: Data can be messy so smoothing is necessary, but smoothing too much can flatten peaks along with the noise or shift the peak positions. It's a balance, not a default setting.
Half cell vs. full cell: Half-cell measurements isolate the reactions of a single electrode (positive or negative) against a stable reference. Full-cell measurements convolve both electrodes' signals together, which makes full-cell dQ/dV harder to interpret on its own. You would typically need prior half-cell data to deconvolute which peak belongs to which electrode.
What features in dQ/dV mean:
Features in dQdV plots can be used to identify reactions and diagnose battery performance over time (Figure 2).
These aren't independent observations, but a real degradation story usually shows up as some combination of shift, broadening, and shrinking happening together, and which combination you see points toward a different failure mechanism.
It’s a simple way to see changes that are happening to the battery chemistry.
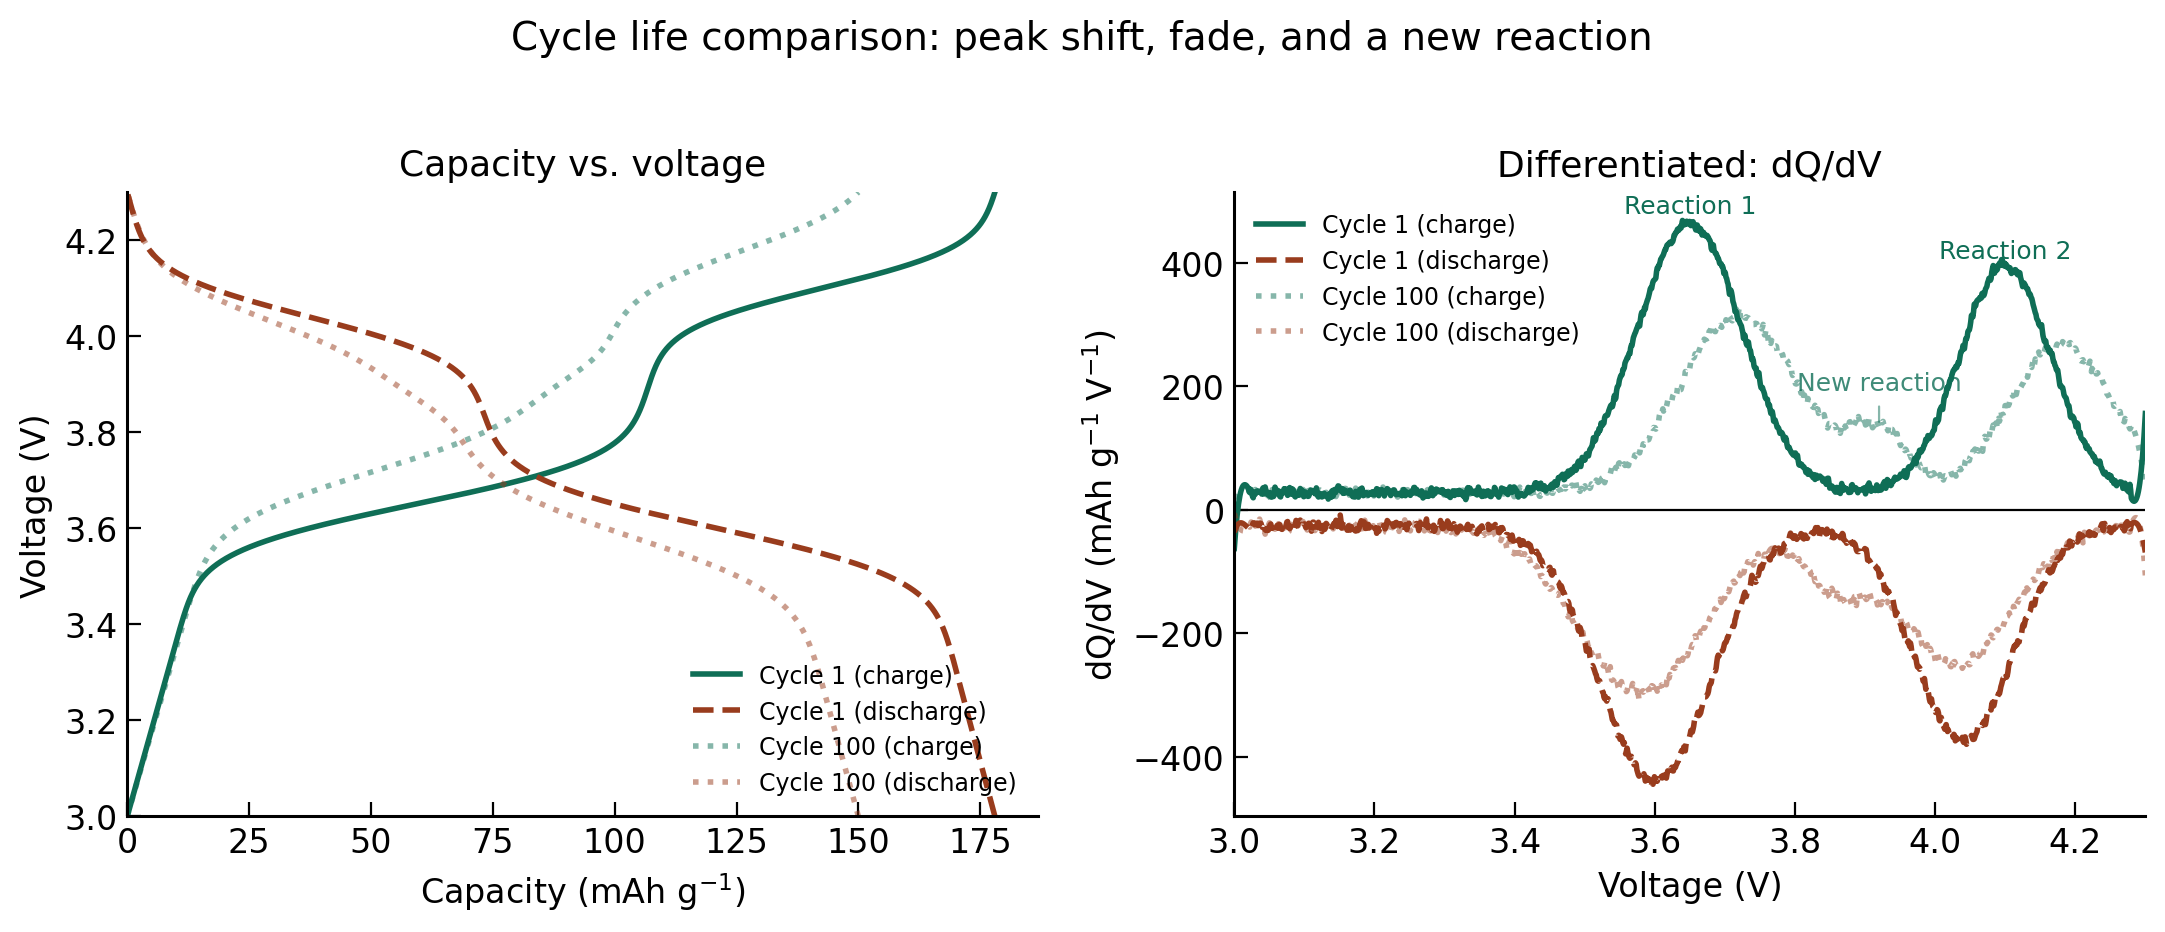
Figure 2. Comparison of Q vs. V plot and the dQ/dV curve after 100 cycles.
Applications:
Material development: For new cathode or anode chemistries, dQ/dV is often the first window into what electrochemical processes are actually happening, much like cyclic voltammetry.
Degradation mode analysis: Changes in dQ/dV peaks can be correlated to specific degradation modes: loss of active material, loss of lithium inventory, and resistance growth all leave distinguishable fingerprints.
Conclusion:
You don’t need anything fancy to do dQ/dV analysis. It just takes a closer look at data you were going to collect anyway. It turns an unremarkable voltage curve into a diagnostic fingerprint you can track for hundreds of cycles. If your peaks are shifting, broadening, or quietly disappearing, your cell isn't being subtle. And looking at the dQ/dV changes is your first big clue into what’s going on.
References:
Olson et al., Chemistry of Materials (2023). DOI: 10.1021/acs.chemmater.2c01976
Dubarry & Anseán, Frontiers in Energy Research (2022). DOI: 10.3389/fenrg.2022.1023555
Smith et al., Electrochemical and Solid-State Letters (2011). DOI: 10.1149/1.3543569
Some resources we love:
This donut labs data analysis uses incremental capacity analysis to determine the cell chemistry