Electrochemical Impedance Spectroscopy (EIS)
A Good Fit Is Not a True Story
TLDR: EIS allows us to analyze the time dependent processes occurring in a battery without actually cycling the cell. It's also the easiest place in electrochemistry to fool yourself: a gorgeous fit with the wrong circuit isn't insight, it's fan fiction.
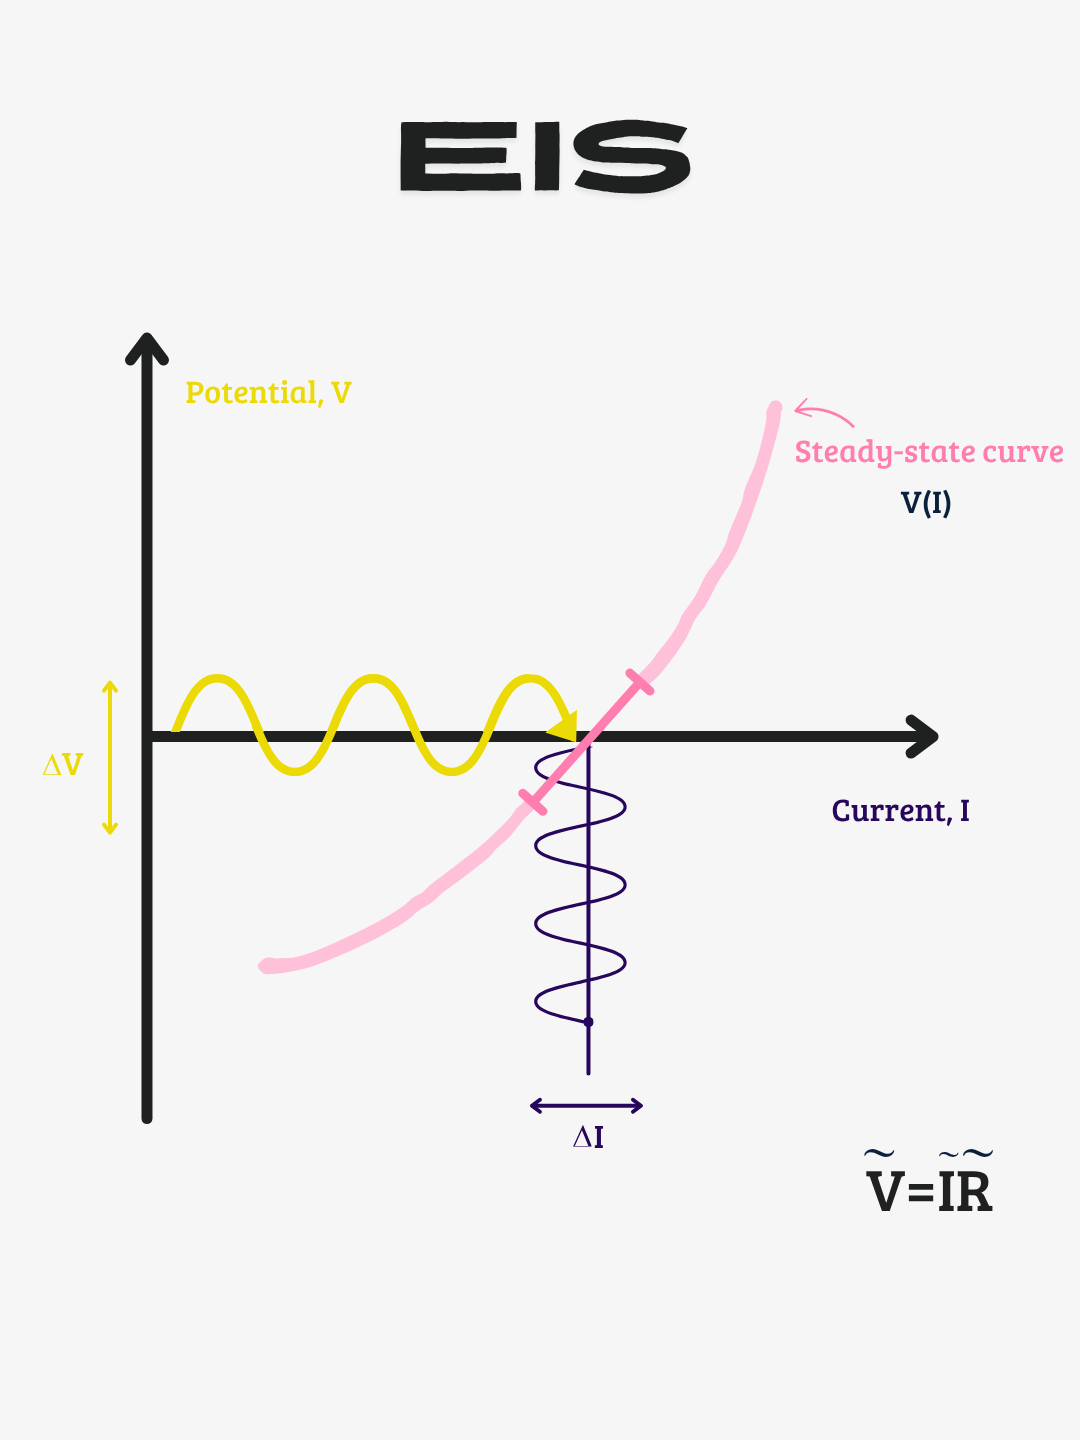
EIS doesn't ask the battery one question. It asks the same question at many different speeds.
What is impedance?
Impedance (Z) at its simplest is resistance in an alternating current system. Impedance captures how the system delays the current relative to the voltage when that voltage oscillates.
Because of that delay, impedance has two parts:
Real part (resistance): the part that acts like normal resistance, turning energy into heat.
Imaginary part (reactance): the part that comes from energy being stored and handed back instead of lost. This is what creates the timing offset between voltage and current. Capacitors and diffusion show up here.
What EIS actually does
Instead of forcing a battery through a full charge or discharge, you apply a very small electrical signal and measure how the cell responds. That signal is usually small enough that the battery stays close to its original state, which is exactly what makes EIS a gentle, non-destructive test.
The useful part: EIS doesn't ask the battery one question. It asks the same question at many different speeds.
High frequencies probe fast processes, often ohmic resistance, contacts, electrolyte resistance, or surface films.
Mid frequencies probe charge transfer and double-layer capacitance.
Low frequencies probe slow mass transport, like lithium diffusion.
That frequency sweep is the whole trick. And because the meaning of any given feature shifts with state of charge and cell age, the same battery can hand you a different-looking spectrum depending on the day you measured it [1].
Why battery people care
A normal voltage curve might tell you a battery has high polarization. EIS helps you separate where that polarization is coming from.
Is it the electrolyte? The interface? A surface film? A charge-transfer limitation? A transport problem?
EIS does not answer those questions automatically. What it gives you is a way to start pulling overlapping processes apart, which is more than a voltage curve will do for you.
The Nyquist plot is a map
The classic EIS plot is a Nyquist plot: the real part of impedance against the imaginary part. Battery people love these because different features tend to line up with different physical processes. A semicircle might suggest charge-transfer resistance paired with capacitance. A low-frequency tail might suggest diffusion. A high-frequency intercept gives you ohmic resistance.
But here's the catch: the plot itself is not the mechanism.
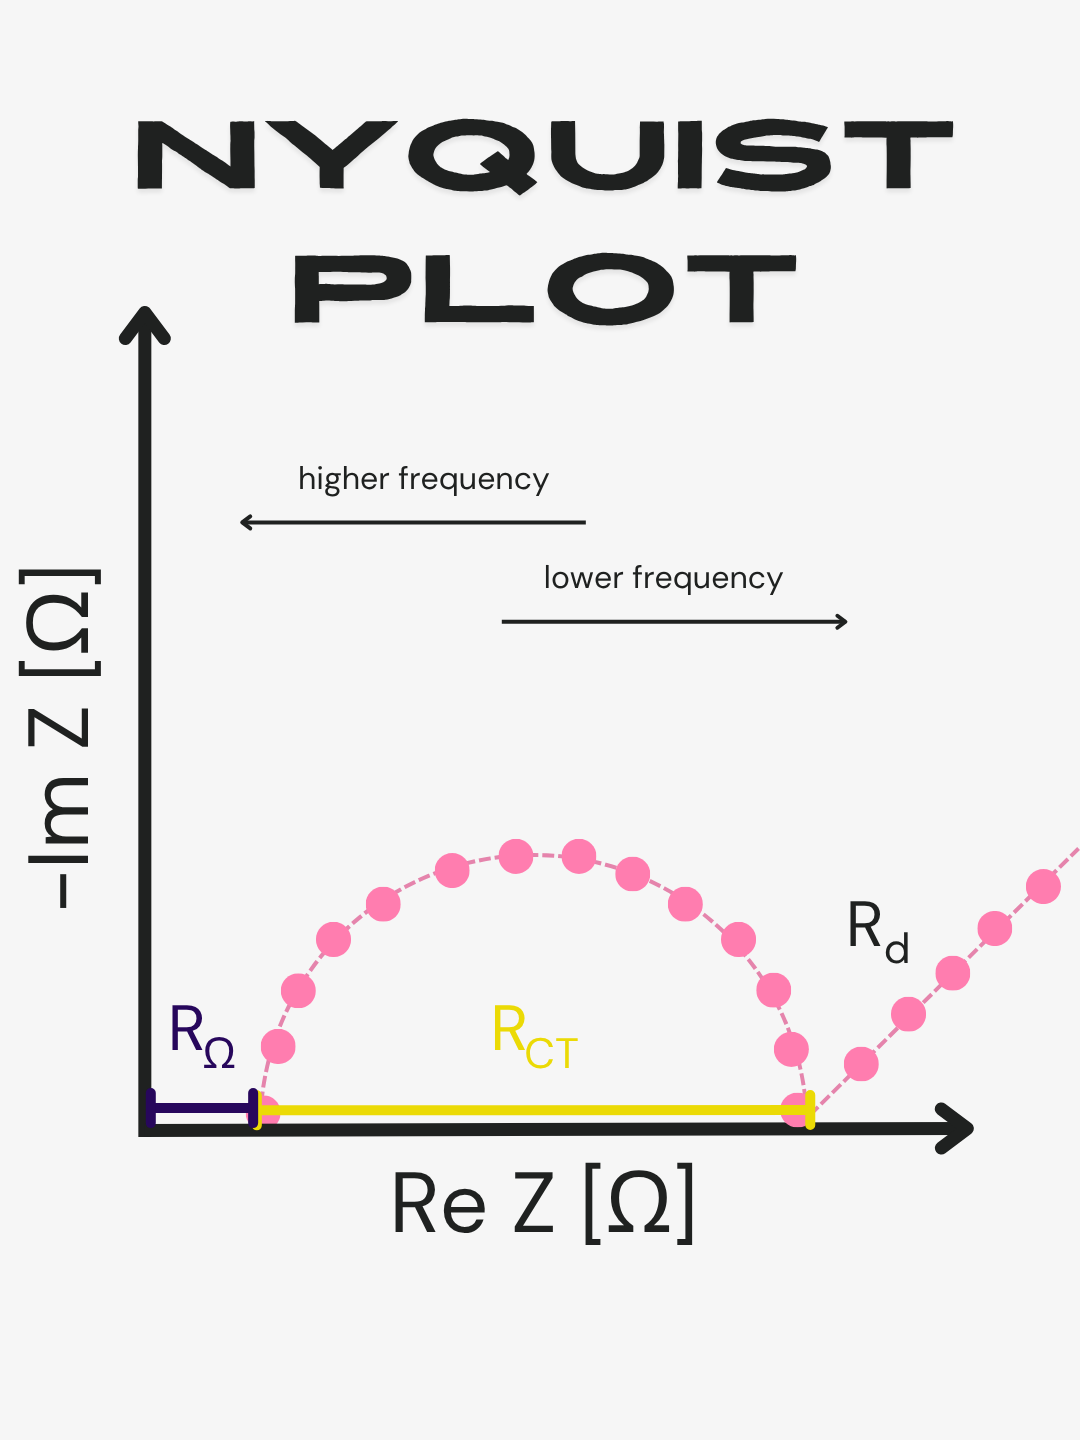
The classic EIS plot is a Nyquist plot: the real part of impedance plotted against the imaginary part.
Each point corresponds to a frequency in Hz [where 1 Hz = 1/s]. The points to the left are at high frequency (smaller times) and as you move to the right you go to smaller frequencies (longer times).
Equivalent circuits: where the lying starts
To interpret EIS, you usually fit the data with an equivalent circuit model (resistors, capacitors, constant phase elements, diffusion elements) chosen to approximate the physical processes in the cell.
The model is only useful if the circuit actually matches the physics.
A pretty fit with the wrong circuit is not insight. A curve can fit perfectly and still be wrong. The versions of this you can actually trust are the ones tied back to a physics-based model, not just whatever RC ladder happened to minimize the residual [3].
Transmission line models: when the cell is a hallway, not a checkpoint
A simple equivalent circuit treats the cell like a few processes stacked neatly in series. That works for well-behaved electrodes. But real electrodes aren't uniform. They're porous, layered, tortuous, and spatially distributed. Ionic current, electronic current, and interfacial reactions don't all happen in one clean location.
A transmission line model is useful when the battery behaves less like a single checkpoint and more like a long hallway with many doors. Current moves through different pathways. Reactions occur at many positions along the electrode thickness, the pore network, and the active interfacial area. Instead of assuming one uniform reaction site, the transmission line model spreads resistance and interfacial impedance across space [4].
This doesn't mean every EIS experiment needs a transmission line model. It does mean that when you're studying porous electrodes like graphite [5], solid-state interfaces, thick electrodes, or systems with nonuniform reaction distributions, simple semicircle-fitting can miss the point entirely [2].
The linearity test (do this before you argue about circuits)
Before debating which equivalent circuit is “right,” make sure the spectrum is valid in the first place. The cell should respond approximately linearly to the small sinusoidal perturbation, remain stable throughout the measurement, and produce a repeatable response. Check signal-amplitude dependence, repeatability, and, ideally, Kramers–Kronig consistency before fitting anything.
Skip this step and you may be modeling the measurement artifact, not the battery.
Bottom line
EIS is powerful because it gives you access to hidden processes inside a working battery. It's dangerous because the data can look more definitive than it really is.
The question is not just: "Can I fit this spectrum?"
The better question is: "Does this model describe something physically real?"
A good fit is not the same thing as a true story.
References
Gordon et al., Electrochimica Acta (2017).DOI: 10.1016/j.electacta.2016.12.013
Zhang et al., ACS Applied Materials & Interfaces (2017).DOI: 10.1021/acsami.7b01137
Geng et al., Electrochimica Acta (2021).DOI: 10.1016/j.electacta.2021.137829
Siroma et al., Electrochimica Acta (2015).DOI: 10.1016/j.electacta.2015.02.065
La Mantia et al., Electrochimica Acta (2008).DOI: 10.1016/j.electacta.2007.12.060