Intro to X-Ray Diffraction (XRD)
What XRD actually measures
At a high level, XRD measures how X-rays interact with periodically arranged atoms in a crystal.
Because the atoms are arranged in a repeating pattern, X-rays scatter in a predictable way, producing diffraction peaks.
Read those peaks correctly, and you get structural information. Read them sloppily, and you’ll be confidently wrong.
Why battery people care about XRD
Battery materials are structural materials. Graphite, LCO, NMC, LFP, and other electrode materials work because atoms occupy particular positions, with particular spacings, and those positions change during synthesis, cycling, aging, and degradation.
XRD is valuable because it can tell you whether a material is crystalline, which phases are present, and whether the lattice is expanding, contracting, ordering, or distorting. In layered intercalation materials, those structural changes can track lithium content closely enough to become a powerful quantification tool.
The basic logic chain is simple:
structure changes → lattice parameters change → plane spacing changes → diffraction peak positions change
That is the entire game.
The concepts you need before reading an XRD pattern
Crystallinity
Crystallinity is the degree of structural order in a material. A crystal has an atomic arrangement that repeats over long distances. Better order produces sharper, more interpretable diffraction peaks. Poor order or amorphous structure gives broad or missing peaks.
Unit cell
The unit cell is the smallest repeating building block of a crystal. The entire crystal structure can be generated by repeating this unit in three dimensions. When we talk about structural changes in XRD, we are often talking about changes to this repeating unit.
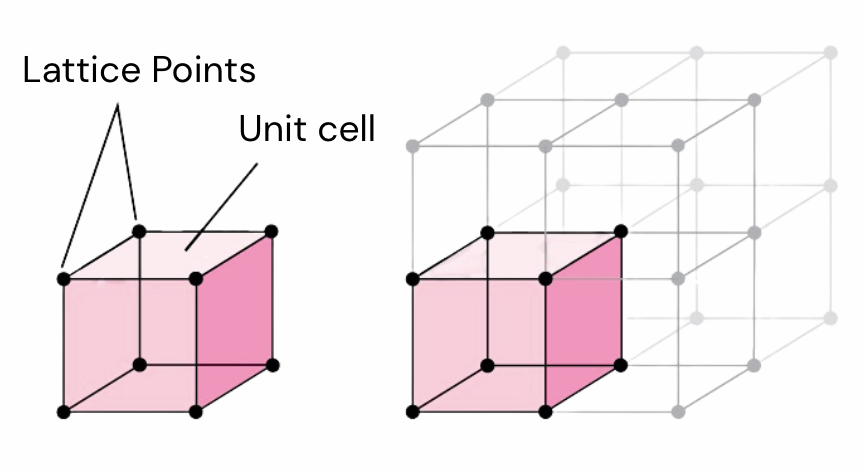
Unit Cell
Lattice parameters
Lattice parameters, usually written as a, b, and c, define the size and shape of the unit cell. If lithium is inserted or removed, transition metals change oxidation state, or layers shift, these parameters can change. When they change, diffraction peaks can move.
d-spacing
d-spacing is the spacing between crystallographic planes. XRD is fundamentally telling you about these spacings. Each diffraction peak corresponds to a specific family of planes, and if that spacing changes, the peak position changes.
Bragg’s law: the peak-position equation
For conventional angle-dispersive XRD, the key relationship is Bragg’s law:
In most lab XRD discussions, you can think in terms of first-order diffraction, where n = 1.
What matters is this:
λ is the X-ray wavelength (typically λ ≈ 1.54 Å)*
θ is the diffraction angle
d is the spacing between crystallographic planes
*In most lab-based XRD systems, the X-ray wavelength is fixed, and the most common source is Cu Kα radiation, with λ ≈ 1.54 Å.
If the X-ray wavelength is fixed, then a change in d must appear as a change in angle. Larger d-spacing shifts a peak to lower angle. Smaller d-spacing shifts a peak to higher angle.
That is the physical meaning of a peak shift.
Miller indices: which planes are you looking at?
Miller indices, written as (hkl), label families of crystallographic planes. They tell you which planes produced a given diffraction peak.
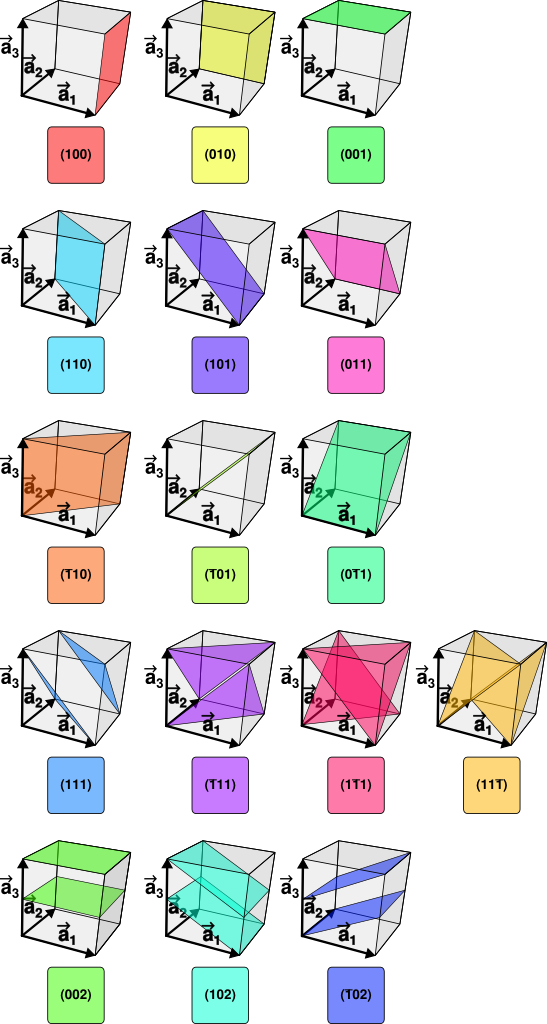
Miller Indices
So “a peak moved” is not enough. The first real question is: which peak?
Relating d-spacing to lattice parameters
Once you know which planes produced a peak, you can connect the measured d-spacing to the unit cell dimensions.
For hexagonal crystal systems (NMC, LCO, graphite), a commonly used relationship is:
This equation connects the measured d-spacing (d) to the Miller indices (hkl) and lattice parameters (a,b,c; for hexagonal materials a=b). That is one of the bridges between a diffraction peak and an actual structural interpretation.
So if lithium extraction changes the layer spacing and changes the lattice parameters, d changes. Then the diffraction angle changes through Bragg’s law. That is how XRD uncovers structural changes.
What XRD is actually measuring in practice
A standard powder XRD experiment measures intensity as a function of diffraction angle, usually reported as intensity versus 2θ. The sample contains many crystallites in many orientations. Whenever a set of planes satisfies the diffraction condition, the detector records intensity at that angle.
The resulting pattern gives you:
peak position, which relates to d-spacing and lattice parameters
peak intensity, which depends on crystallinity, preferred orientation, occupancy, and geometry
peak width and shape, which can reflect crystallite size, strain, disorder, and instrumental broadening
Why this matters for battery materials
Layered battery materials are especially well suited to XRD because electrochemistry changes the lattice in measurable ways. In graphite, interlayer spacing evolves with lithiation. In layered oxides such as LCO and NMC, lithium removal changes transition metal oxidation state and alters slab spacing and unit-cell dimensions. You can find our collection of crystallographic information files (.cif files) here for your own XRD analysis.
These structural responses can be tracked through diffraction peak movement and modeled quantitatively.
What comes next
This first piece is the foundation: crystals, unit cells, lattice parameters, d-spacing, Miller indices, and the equations that connect them.
The next parts can build from here into:
angle-dispersive versus energy-dispersive XRD
peak assignment and refinement
using XRD to quantify lithium content in real battery materials
Because yes, you can get from a peak shift to lithium content (in NMC). But only after you work for it.
Some Resources We Love:
A comprehensive review paper on XRD
Unit cells and different structures explained
Advanced Level XRD
WTF is EDXRD
Most people hear XRD and think of the standard lab scan: peaks plotted against 2θ and a clean diffraction pattern.
That is angle-dispersive XRD.
But there is another version that shows up a lot in synchrotron work, operando experiments, and fast time-resolved studies:
energy-dispersive X-ray diffraction, or EDXRD.
Same physics. Different measurement strategy.
And if you have ever stared at an EDXRD pattern and thought, “why is this peak in energy instead of angle and wtf is my life” this is for you.
ADXRD vs. EDXRD
ADXRD: the version most people mean when they say “XRD”
Angle-dispersive X-ray diffraction (ADXRD) measures diffraction intensity as a function of angle, usually reported as 2θ, while using a fixed X-ray wavelength.
How it works:
X-ray energy is fixed
wavelength is fixed
the instrument scans angle
the detector records intensity vs. 2θ
Then you use Bragg’s law to convert peak position into d-spacing.
Why it is the standard:
standard lab technique
easier to interpret for routine structure work
This is the classic powder diffraction workflow.
EDXRD: same Bragg’s law, different lever
Energy-dispersive X-ray diffraction (EDXRD) measures diffraction intensity as a function of X-ray energy while holding the diffraction angle fixed.
How it works:
diffraction angle is fixed
the beam contains a range of X-ray energies
the detector separates diffracted signal by energy
the output is intensity vs. energy
From there, energy is converted to wavelength, and wavelength is used to calculate d-spacing.
Where it is useful:
synchrotron experiments
in situ and operando cells
fast time-resolved measurements
EDXRD is useful when you care about speed, in situ geometry, or operando structural evolution.
TLDR
ADXRD = cleaner structural readout
EDXRD = faster dynamic readout
Also this is why every XRD plot should be shown in inverse d-spacing for consistent x-axes
The trick: turning structure into a solvable math problem
Once you measure peak positions, you convert them into d-spacings.
Those d-spacings are then related back to the crystal structure using the appropriate lattice equation. For layered battery materials, that usually means tracking how the lattice parameters change with state of lithiation or structural evolution.
Directly solving for lattice parameters from multiple peaks gets messy fast.
So instead of brute-forcing the nonlinear form, you can rewrite the lattice relationship into a form that behaves like a linear regression problem.
Conceptually, the move is:
redefine grouped terms as fitting coefficients
rewrite the structure equation into something that looks like
y = αx₁ + βx₂treat each diffraction peak as one data point
use least-squares fitting to determine the coefficients
convert those coefficients back into the real lattice parameters, a and c
This is basically refinement logic in miniature.
You start with a structural model, compare it to measured diffraction data, and let the math find the best-fit parameters.
Why the (003) peak is such a diva
For layered hexagonal materials, the (003) reflection is especially useful because it depends only on c.
That makes it incredibly handy for constraining the out-of-plane lattice parameter.
In practical terms:
(003) helps pin down c
(101) and (104) help capture the combined lattice behavior
together, they give enough information to solve for both a and c
This is also why people get emotionally attached to a good (003) peak.
Practical reality: peak selection and fitting matter more than people admit
XRD does not hand you lattice parameters.
It hands you peaks. Then you decide whether to be smart or chaotic.
In our case, the lattice parameters were extracted by fitting d-spacings from selected reflections to the hexagonal structure equation using linear regression. The peaks used were:
(101)
(104)
(003)
These were chosen because they were the cleanest reflections in the EDXRD dataset.
The 003 peak is especially handy because it depends only on c, so it helps pin that value down.
The (10-2) reflection was intentionally excluded due to overlap with signal from the Al current collector, which could absolutely wreck the analysis.
“Quantitative XRD” gets fake very quickly when your peak selection is garbage.
When the (003) peak splits and ruins everyone’s day
In some cases, the (003) reflection shows peak bifurcation rather than a single clean maximum. Known as peak bifurcation, BBB covered it here.
When splitting of the (003) reflection was observed, the peak was fit using a double-Gaussian model. A weighted average of the two peak positions was then used to determine the effective peak maximum (I wasn’t the first to do this- see Li et al paper, and my own SI- fig S6 and EqS14).
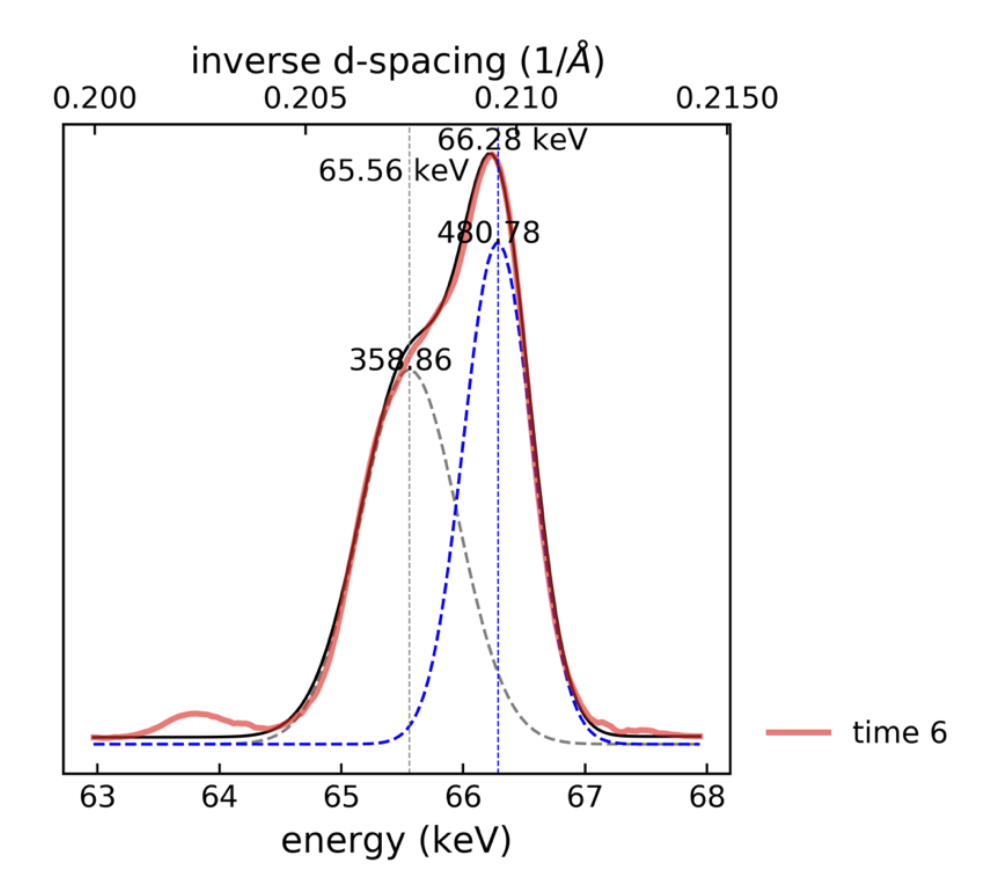
Fig S6 from my paper: look at that crazy looking (003) peak.
From lattice parameters to lithium content
Instead of solving directly for a and c, I rewrote the equation in a linear form, fit the data with least squares, and then converted the fit coefficients back into the real lattice constants.
Once a and c are determined, you can calculate the c/a ratio.For some layered cathode systems, that ratio acts as a structural proxy for lithium deficiency.
For NMC111 we used this amazing Gasteiger group paper (fig4 is ::chef’s kiss::).
Using the empirical relationship:
where x represents lithium deficiency in the material.
That lets you go from diffraction peak positions → lattice parameters → c/a ratio → estimated lithium content.
Which sounds very powerful, because it is.
But the most important part:
You are not measuring lithium directly. You are measuring structure and then inferring lithium content through an empirical model.
What this actually means in practice
EDXRD is not the off-brand version of XRD. It is what you use when structure is moving fast and you still want to catch it in the act.
And once you have the peaks, the real work is:
choosing reflections that are actually trustworthy
fitting them correctly
converting peak position into d-spacing
fitting the structural model
understanding what the model can and cannot tell you
References
Li et al., Chemistry of Materials (2020). DOI: 10.1021/acs.chemmater.0c00983
Buchberger et al., Journal of The Electrochemical Society (2015). DOI: 10.1149/2.0721514jes