Cyclic Voltammetry (CV)
TLDR: CV is speed dating for electrodes. You sweep the potential, watch who reacts, and decide if there’s real chemistry or just good lighting.
CV maps who’s oxidizing, who’s reducing, and who’s lying about being reversible. It won’t tell you capacity, but it will expose whether your chemistry actually works like a battery or just wants the aesthetic.
Cyclic voltammetry (CV) is one of the most widely used electrochemical techniques in battery research: it provides fundamental insights into the redox behavior, stability, reaction kinetics, and reversibility of electrode materials. By sweeping the potential of a working electrode in a cyclic manner and recording the resulting current, researchers can understand the electrochemical processes that govern battery performance.
In the context of rechargeable batteries such as lithium-ion, sodium-ion, and emerging solid-state systems, CV is a powerful diagnostic tool for evaluating electrode materials, electrolytes, and interfacial phenomena.

Figure 1: Three-Electrode Setup for CV
Key components include:
Working electrode: typically coated with the active battery material.
Counter electrode: often a conductive material like platinum.
Reference electrode: ensures stable and well-defined potential (e.g., Li/Li⁺ in lithium systems).
Electrolyte: provides ionic conductivity.
Principle of Cyclic Voltammetry
In CV, the potential of the working electrode is swept linearly versus time at a defined scan rate (ν), and reversed once a set potential limit is reached. The resulting current response (I) is plotted as a function of potential (V), generating a cyclic voltammogram. The resulting voltammogram contains oxidation and reduction peaks, corresponding to charge storage and release processes within the electrode material as shown in Figure 2.

Figure 2: A cyclic voltammogram
The Randles–Sevcik equation describes the electrochemical reversible process during diffusion. For diffusion-controlled processes, the Randles–Sevcik equation governs the peak current (Ip):

Figure 3: Diffusion-Controlled Behavior in CV

Randles–Sevcik equation
Where:
Ip = peak current (A)
n = number of electrons transferred
A = electrode area (cm²)
D= diffusion coefficient (cm²/s)
C = concentration of electroactive species (mol/cm³)
ν= scan rate (V/s)
The current response in the absorbed species ideally varies liner with the scan rate. The peak-to-peak separation in the reduction and oxidation peak shifts with the scan rate is observed in the reversible process. However, there is no such shift observed in the surface absorbed species.
Applications of CV in Battery Research
1. Determination of Redox Potentials
CV identifies the oxidation and reduction peaks, which correspond to the working potential range of the electrode material.
These values help define the voltage window for safe and efficient battery operation.
2. Evaluation of Reversibility
The symmetry and overlap of the forward (oxidation) and reverse (reduction) peaks indicate how reversible an electrochemical reaction is.
A highly reversible electrode material is desirable for long cycle life.
3. Kinetic Studies
The peak current (Ip) is proportional to the square root of the scan rate for diffusion-controlled processes.
By analyzing current vs. scan rate, researchers can distinguish between diffusion-controlled and capacitive (surface-controlled) charge storage.
4. Investigation of Electrolyte Stability
CV can probe electrolyte decomposition by scanning to high or low potentials.
This is particularly useful for evaluating new liquid, polymer, or solid-state electrolytes.
5. Formation of Solid Electrolyte Interphase (SEI)
In lithium-ion systems, initial CV cycles reveal SEI formation on the anode.
This process appears as characteristic reduction peaks in the first cycle and stabilizes in subsequent scans.
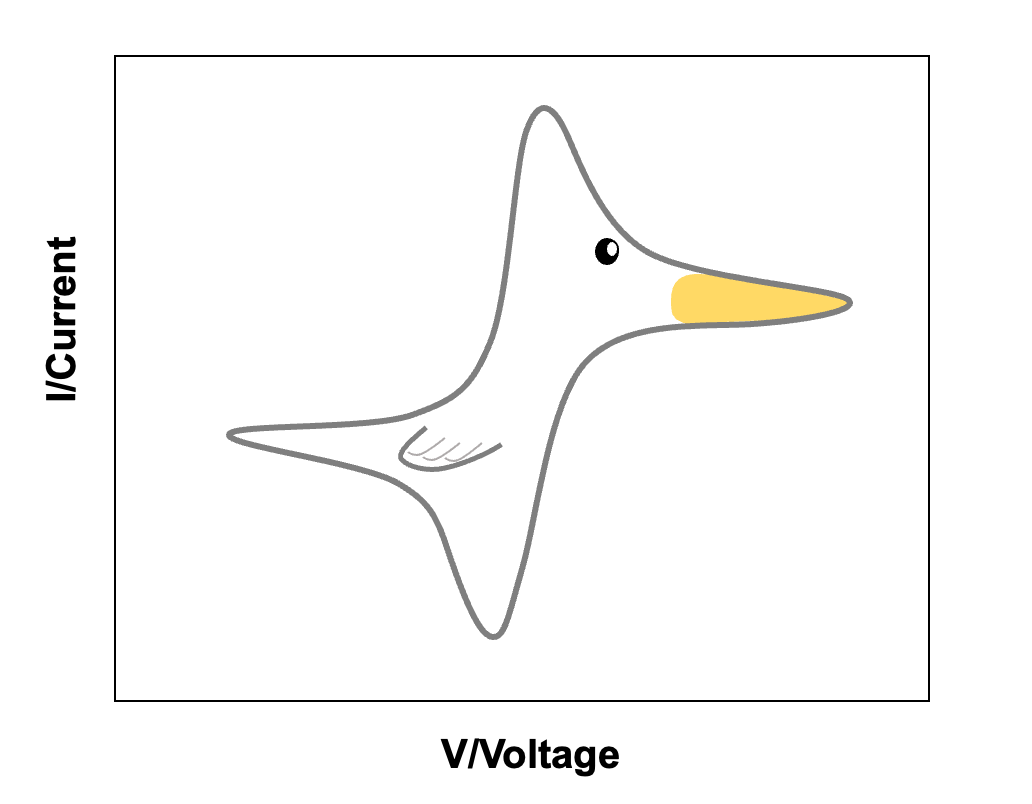
Figure 4: CV plots are called “Duck Plots” in the industry
Data Interpretation
A typical cyclic voltammogram for a battery electrode displays:
Cathodic peak: ion insertion (e.g., Li⁺ intercalation).
Anodic peak: ion extraction (e.g., Li⁺ deintercalation).
Peak separation (ΔEp): indicates reaction kinetics: smaller values correspond to faster and more reversible processes.
Peak current (Ip): relates to diffusion coefficients and electrode surface area.
Conclusion
CV is the first date, not the wedding. Use it to learn the chemistry, set safe voltage windows, and decide what to test next. Then bring in EIS and cycling to confirm if it’s a keeper. If your CV trace looks weird, it’s not your chemistry having a personality: it’s your experimental design begging for a second draft.
References:
[1] Bard, A. J.; Faulkner, L. R. Electrochemical Methods: Fundamentals and Applications, 2nd ed.; Wiley: New York, 2001.
[2] Compton, R. G.; Banks, C. E. Understanding Voltammetry, 4th ed.; World Scientific: Singapore, 2018
[3] Wang, J.; Chen, J. Electrochemical Principles for Battery Materials Characterization by Cyclic Voltammetry. ChemElectroChem 2015, 2 (10), 1548–1556.
[4] Xu, K. "Electrolytes and Interphases in Li-ion Batteries and Beyond." Chemical Reviews, 2014, 114, 11503–11618
Resources we love:
🔋 This paper is a great beginner’s resource on CV
🔋 If you’re a biologic fan this guide is helpful too